Appendix I
Appendix I
The problem of information centralisation, and even the more specific problems Chapter 1 catalogued (hallucination, disinformation, data siloing, the concentration of power, the tension between capability and democratic values) are not new. Looking across history, both the high level centralisation issue and more specific manifestations appeared at similar moments, such as when the Library of Alexandria centralised the ancient world’s knowledge, when the encyclopedia centralised Enlightenment scholarship, and when the mainframe centralised computing. In each of these cases (and in other cases), the centralised phase eventually gave way to something more distributed. But as far as this author is aware, in every case but one, centralisation only gave way to federation after a long period of time, and after a tremendous amount of centralisation-driven damage had been done.
A Recurring Pattern of Centralisation and Federation
The pattern is worth tracing briefly, because the details matter. Each case centralised for the same structural reason, created genuine value, concentrated control as a side effect, and eventually gave way to a federated alternative. But the circumstances under which federation occurred, and the costs that accumulated before it did, varied enormously.
The Library
For most of recorded history, a scholar who wished to draw on many sources had to travel to find them. Written texts were scarce, scattered across cities and temples, and the cost of copying a manuscript by hand meant most works existed in only a few copies. The path of least resistance was centralisation: bring the texts to one place.
The Library of Alexandria, founded under the Ptolemaic dynasty in the third century BCE, represents the most ambitious attempt. The Ptolemies aimed to house every written work in the known world, and their acquisition methods were aggressive. Scholars were dispatched abroad to purchase or copy any works of importance1. Ships arriving in Alexandria’s harbour were searched for books, which were confiscated, copied, and catalogued; the originals were kept by the library and copies returned to their owners, a practice so routine that the confiscated works were designated “from the ships” as a cataloguing category Casson, 20012. The result was a genuine achievement in broad listening: for the first time, a single scholar could sit in one room and consult thousands of independent sources, comparing accounts, identifying contradictions, and drawing insights that no single source could provide.
But Alexandria was also a centralisation of control, and the centralisation followed a structure familiar from Chapter 1. The Ptolemaic dynasty determined what was collected, who could access the collection, and which versions of a text were authoritative when multiple copies disagreed. Access was restricted to royally appointed scholars who depended on the crown’s continued patronage for their stipends and tax exemptions Casson, 2001. The Sceptic philosopher Timon of Phlius, a contemporary of the library’s peak under Ptolemy II Philadelphus, dismissed its scholars as “bookish scribblers who spend their whole lives pecking away in the birdcage of the Muses” Canfora, 1989. A smaller daughter library was later established in the Serapeum, where unaffiliated scholars could access copies of many manuscripts in what the fourth-century rhetorician Aphthonius described as “reading rooms for books, offering an opportunity for the studious to pursue knowledge and arousing the whole city to the possibility of wisdom” Kennedy, 2003, but the Great Library itself remained a royal institution whose collections served those the crown chose to support3.
The centralisation was contested even at the time. During the third century BCE, the Attalid king Eumenes II established a rival library in Pergamum, and the two institutions competed for scholars, manuscripts, and prestige in what amounted to an intellectual arms race between Hellenistic powers Casson, 2001. Each library tried to attract the other’s scholars by offering higher stipends, and Ptolemy V reportedly imprisoned the grammarian Aristophanes of Byzantium to prevent his defection to Pergamum4. When Pergamum’s collection grew large enough to threaten Alexandria’s dominance, the Ptolemies retaliated by banning the export of papyrus, forcing Pergamum to develop parchment as an alternative writing material5. Information overload was addressed through centralisation, centralisation created genuine value, and the entities that managed the centralised resource acquired considerable power over what could be known.
When the library’s collections were eventually damaged and dispersed (gradually, over several centuries, through a combination of declining patronage, civil strife, and religious conflict rather than the single fire of popular imagination Canfora, 1989), works were lost that humanity never recovered, precisely because no redundant copies existed outside the centralised collection6. Federation came through the slow proliferation of libraries across institutions and geographies, but that federation required technical infrastructure that did not exist in Alexandria’s era: first the codex, then eventually the printing press7, which reduced the cost of copying so dramatically that centralised control over reproduction became impractical.
The Encyclopedia
By the eighteenth century, the printing press had solved the library’s centralisation problem so thoroughly that it created a new one. There were now so many books that no individual could read them all. Information overload had shifted from scarcity of sources to abundance, and the path of least resistance was once again centralisation: compress the essential knowledge of the era into a single reference work8.
The Encyclopédie, edited by Denis Diderot and Jean le Rond d’Alembert and published between 1751 and 1772, was motivated by genuine democratic idealism. Diderot’s explicit aim was to “change the common way of thinking” through the expansion of knowledge and the development of critical modes of thought Diderot, 17519. The impulse is recognisably the same one that animates much of the enthusiasm for AI, and for open-source AI in particular: the hope that technology can democratise access to knowledge10.
But the Encyclopédie was also a centralisation of editorial authority. Even though the work was circulated openly, Diderot and his collaborators decided what counted as knowledge and what did not. Subsequent encyclopedic traditions demonstrated that this authority is consequential: national encyclopedias in the nineteenth and twentieth centuries became instruments of state ideology in multiple countries11. Even the Encyclopædia Britannica, which aspired to political neutrality, necessarily reflected the editorial judgments of a small group about what the world’s knowledge contained12.
Federation came through technical infrastructure. The proliferation of publishing distributed editorial authority across many authors and publishers. Much later, Wikipedia distributed the encyclopedic impulse itself across millions of contributors governed by transparent rules and versioned accountability rather than a single editorial vision Wikipedia, “Governance”. Wikipedia has well-documented problems of its own, but its architecture makes editorial decisions distributed and auditable in ways that earlier encyclopedias structurally could not achieve13.
The Computer
In the 1950s and 1960s, the dominant vision of computing’s future was centralised. Computation was so expensive that only governments, large corporations, and research universities could afford it, and the prevailing expectation (shared by most of the industry, including IBM, which controlled roughly two-thirds of the market) was that this would remain the case indefinitely. Computing would be a service: large machines owned by large institutions, accessed through terminals, controlled by whoever owned the hardware14.
Unlike the library and the encyclopedia, the mainframe’s centralisation was partly a failure of imagination. The machine itself did not require centralisation in the way a manuscript library required physical co-location of scrolls; it was the cost of the machine that made centralisation seem inevitable, and the cost was falling15. The question was whether the institutions that controlled mainframes would entrench their position before alternatives became viable16.
The Arc of Invention, Centralisation, and Federation
Across these three cases, a recognisable structure recurs. A new information technology emerges that enables broad listening at a scale not previously possible. The technology centralises, because centralisation is the path of least resistance when it is easier to bring information to one place than to build infrastructure for many places to share it, and the centralisation is typically coordinated by the most powerful actors of the day, who are in a financial position to be first movers on major new technologies. The centralisation creates genuine value, but it also concentrates control over what can be known, who can know it, and whose contributions are included. And eventually, new technical infrastructure emerges that enables federation: an arrangement that preserves much of the value centralisation created while distributing the control it concentrated.
The structure of AI’s current situation, as described in Chapter 1, fits this pattern. AI centralises because centralisation is the path of least resistance; the centralisation creates genuine value; the same centralisation concentrates control; and the technical work in Chapters 2 through 4 describes infrastructure that could, if it scales as anticipated, enable a federated alternative. Whether the historical parallel is predictive (whether AI’s centralised phase will end on a similar timeline and for similar reasons) is a question this thesis cannot answer. But the parallel does clarify what the technical work in earlier chapters is for: building the federated infrastructure for the current instance before the centralised phase locks in.
The Key Variable: The Size of the Peak
If centralisation always gives way to federation, one might reasonably ask why it matters. If it is a phase, and the phase always ends, perhaps the right response is patience. The reason it matters is that the pattern does not specify how long the centralised phase lasts or how much damage accumulates during it. Alexandria’s centralisation lasted centuries. When the library’s collections were dispersed, works of antiquity were lost permanently, because no redundant copies existed outside the centralised collection. The vision of centralised mainframe computing persisted for roughly two decades and might have persisted far longer, entrenching a world in which there would be no personal computer, no open internet, and no possibility for an individual to publish, compute, or communicate without institutional permission.
The variable that determines the cost is the duration of the peak: how many years, decades, or centuries a small number of institutions control what can be collectively known (who can access knowledge, and whose contributions are counted as “knowledge”). A shorter peak means less entrenchment, less lock-in, and an easier transition when federated infrastructure arrives. A longer peak means centralised institutions have more time to build network effects, regulatory capture, and user dependence that make federation harder to achieve, even after the necessary technical infrastructure exists17.
In most historical cases, nobody shortened the peak deliberately. The printing press did not emerge because someone set out to federate the library; it emerged because movable type was a useful technology, and federation was a consequence. Wikipedia’s founders did set out to build a better encyclopedia, but the infrastructure that made their project possible (the web, and before it the internet) was not built for that purpose; it was built for general communication, and the encyclopedic application followed. Yet, there is one case in which someone recognised the pattern while the centralised phase was still underway and acted deliberately to shorten it.
Licklider et al. Shortened the Peak
In 1960, J.C.R. Licklider published a paper titled “Man-Computer Symbiosis” arguing that the future of computing lay in augmented communication, enabling humans to think together through machines in ways that neither could achieve alone Licklider, 1960. Nine years later, he became the first director of the Information Processing Techniques Office at ARPA, a position from which he controlled a significant portion of the US government’s computer science research funding.
The mainframe era was at its height, with IBM controlling 70 to 80 percent of the mainframe market in most industrialised countries Cortada, 2018 and the prevailing assumption, shared by industry and most of the research community, that computing’s future was centralised: large machines owned by large institutions, accessed through terminals. Licklider thought otherwise, and he articulated his alternative most fully in a 1968 paper co-authored with Robert Taylor, “The Computer as a Communication Device” Licklider & Taylor, 1968. The paper described what Licklider and Taylor called “cooperative modeling”: the idea that networked computers could enable groups of people to build shared understanding, testing their mental models against each other’s knowledge at a speed and scale that unaided human communication could not match. The prediction was about computers enabling a new kind of communication, and in particular a new kind of listening, as opposed to merely thinking for themselves.
What Licklider did next is the part that matters here. Rather than arguing that the mainframe era should end or waiting for the cost of hardware to fall far enough that decentralisation would happen on its own, he used ARPA’s funding authority to build federated infrastructure before the centralised paradigm could entrench itself permanently. The result was the ARPANET, and the key architectural decision was that the network used packet switching rather than circuit switching: the protocols making the network valuable (TCP/IP, and later HTTP) were open standards that no company owned and no institution controlled. The network effects accrued to public infrastructure rather than to any single institution.
The outcome was far from inevitable. IBM could have built a proprietary network. Bell Telephone could have extended its monopoly into data transmission. Either outcome would have produced some form of networked computing, but the network effects would have routed through private infrastructure rather than public protocols. Licklider’s intervention ensured that the federation of computing happened on terms that kept the foundational layer open.
The internet produced some of the most valuable corporations in history, but those corporations emerged on top of public infrastructure rather than in place of it. Licklider shortened the peak by building the federated alternative while the centralised institutions were still dominant, before they had locked in their advantage for the next chapter of the technology. The base layers remain open: anyone can still transmit a packet, register a domain, send an email across servers they do not own, because the protocols that Licklider’s successors built, TCP/IP, HTTP, SMTP, belong to no corporation and no corporation can revoke your access to them. Google built the most popular building on a road it did not construct, and then made the building very difficult to leave.
But openness at the foundation did not guarantee openness at every layer above it. Search, social, messaging, and commerce consolidated in ways the network layer never did, and they consolidated without anyone playing Licklider’s role. No programme manager saw the coming lock-in early enough, with both the institutional authority and the intellectual clarity to insist the next layer be built on open terms before private alternatives foreclosed the possibility. The window that existed in the 1960s for decentralised networking opened again in the 1990s for the application layer and closed without anyone walking through it.
AI and the Current Peak
The same pattern is visible in AI, driven by the same three causes of centralisation that Chapter 1 identified. The volume of data relevant to AI training exceeds what any single institution can curate, yet a handful of firms have scraped the public web and compressed it into models they control, which is structurally the Alexandrian move: bring everything to one place because building infrastructure for distributed synthesis is harder. Data owners decline to contribute because contributing currently means surrendering a copy, so medical institutions, publishers, financial firms, and billions of individuals withhold data because the architecture offers no mechanism for sharing without losing control, siloing resources in ways that hamper collective productivity just as isolated mainframes did before ARPANET gave them a way to share. And because AI users cannot verify which sources inform which predictions, the response has been structurally encyclopedic: where Diderot’s editorial board decided what counted as knowledge, AI developers employ trust and safety teams, reinforcement learning from human feedback, and armies of annotators to curate what their models will say.
Each of these causes of centralisation is also a failure of distributed power: information overload leaves individuals unable to hear everyone with something relevant to say, privacy failure locks data owners out unless they surrender control, and veracity failure lets some actors inject false information into systems whose users cannot trace what they receive, and because the curation is invisible, users cannot evaluate it either, which is why the same opacity that produces hallucination also produces the political suspicion: the left sees bias toward toxicity, the right sees bias toward censorship, and neither can verify the claim because the editorial process that would settle the question is not legible to anyone outside the lab. The consequences Chapter 1 catalogued are not separate problems requiring separate policy interventions but manifestations of a single architectural limitation playing out at different levels of scale: hallucination and disinformation trace to veracity failure; copyright disputes and bias trace to information overload, which created no licensed alternative to scraping and no mechanism for hearing voices outside the dominant training corpus; data siloing traces to privacy failure; and concentration of power and the geopolitical dilemma both trace to information overload forcing centralisation, because whoever aggregates the most data wins, and at the corporate level that concentrates power in a handful of firms while at the nation-state level it forces democracies to either centralise to compete or cede the advantage to nations that face no constraints on doing so.
What made each previous centralised phase recoverable was that it concentrated control over one part of the listening problem, and over a fraction of the world’s knowledge. Alexandria held perhaps half a million scrolls. The Encyclopédie synthesised the knowledge of eighteenth-century European scholarship. The mainframe supplied processing power to institutions that could afford one. Each was a large concentration by the standards of its time, but each was also bounded: by what had been written down, translated, shipped to Egypt, or priced within reach of a corporate data centre.
AI has no equivalent bound. The institutions building frontier models have scraped essentially everything humanity has recorded, across languages, disciplines, and centuries, and compressed it into systems that a significant fraction of the world’s population already uses to make decisions. No previous centralised phase concentrated anything close to that share of the world’s information and decision-making within a single architectural chokepoint, which means the absence of a Licklider figure at this moment carries a different order of consequence than the failure to keep the application layer open in the 1990s. The window that closed then cost us open social infrastructure. The institutions accumulating network effects, regulatory leverage, and researcher dependence around frontier AI are not building on top of listening infrastructure the way Google built on TCP/IP. They are building the listening infrastructure itself, and building it closed18. However, while this problem might now seem clear and straightforward, there is significant reason to believe that the stakes of cutting the current AI peak are considerably higher than those were for the library, encyclopedia, or mainframe computer.
The Deeper Problem
Throughout the history of information technology, one side of a fundamental asymmetry has scaled faster than the other. Broadcasting, the ability to transmit information from one to many, has scaled repeatedly: from the spoken word to writing, from writing to the printing press, from the press to radio and television, from broadcast media to the internet. Each advance enabled a single source to reach a larger audience, and the project is now, for practical purposes, complete: one person can broadcast a message to billions in seconds.
Listening, the ability to synthesise information from many sources into coherent understanding, has not kept pace. While a scholar in Alexandria could consult thousands of sources, a reader of the Encyclopédie could access tens of thousands, and a user of the modern internet can in theory reach billions, each person in the world still (mostly) listens to one person at a time. The ability to synthesise what billions know, to evaluate conflicting claims, weight sources by reliability, and arrive at understanding that accounts for the full complexity of available evidence has remained constrained by individual human cognition. Broadcasting scaled with technology; listening scaled with attention, but attention did not grow along with it, and this asymmetry has shaped how societies manage information, make decisions, and distribute power for as long as societies have existed. Yet, to really understand the complex nature of the current moment, it would be too hasty to say that civilisation has not scaled listening at all… it has had four tools to do so, and the constraints of those tools have had a profound impact on how power is distributed in the world which is instructive for considering the stakes of the current moment.
Four Tools for Listening
The oldest is the literary canon: a set of entrance criteria that determine which statements are preserved and transmitted. Oral traditions, religious texts, academic literature, news organisations, and Wikipedia are all literary canons with different entrance criteria. A canon preserves the full nuance of what each source has to say, but it has a scaling problem. To synthesise a canon, someone must read ten sources and compress them; someone else must read ten compressions and compress again; and so on through as many layers of synthesis as the volume of material demands. The process preserves nuance at each step but requires human attention at every layer, and it can take generations to propagate through a large body of knowledge.
The second tool is statistics. Born with the first national censuses around 3800 BCE, statistics solves the scaling problem by requiring each source to reduce its testimony to a number according to a shared schema: a set of acceptance criteria for what counts (literally… an event worth counting). Once this reduction is made, broad listening can scale to billions through statistical tools like sums, averages, standard deviations, and other statistical techniques. While it might appear that this synthesis tool is for the sciences, its impact has had a profound impact on every aspect of modern society. For example, elections are a statistical broad listening tool: each citizen compresses their political judgment into a single vote. Market pricing is another: each participant compresses their assessment of value into a bid or ask. The power of statistics is real, but the cost is the nuance that the reduction discards. Age becomes a number; political judgment becomes a binary choice; the multidimensional reality of supply, demand, context, and quality collapses into a price. Through statistics, life—which is inherently a fill-in-the-blank experience—becomes multiple choice as society scales.
The third tool is sampling: instead of reducing everyone’s testimony to a number, select a small group and listen to them fully. Focus groups, market research, ethnographies, clinical trials, and judicial juries are all sampling techniques. Sampling preserves nuance but sacrifices completeness. Select the wrong sample and you hear a distortion; select a biased sample and you hear what you wanted to hear; and even when done well, you are still typically listening to dozens or hundreds, not millions.
The fourth is indexing: cluster sources into labelled groups so that one of the other three tools can be applied to a relevant subpopulation. The Dewey Decimal System, search engines, and medical diagnostic codes are all indexes. Indexing does not itself perform synthesis; it organises the material so that canons, statistics, or sampling can be applied more precisely.
Nearly every modern institution for managing information at scale, and nearly every web or smartphone app, is some permutation of these four tools. Yelp combines a literary canon (reviews) with a statistic (star ratings). Uber combines an index (who is nearby) with three statistics (driver ratings, rider ratings, and auction pricing). LinkedIn combines a literary canon (profiles), an index (search and connections), and a sample (the algorithmically curated feed). Democracy combines a statistic (the vote) with a literary canon (the free press) and sampling (opinion polls). Look across any major platform or institution and the same four components recur in different configurations to enable one person to understand the aggregate information of a group.
The four tools have sustained civilisations for centuries, but none of them does what a true broad listening tool would do: synthesise with the nuance of a literary canon at the scale of a statistic. Every institution built on these tools faces the same structural trade-offs: scale or nuance, scale or veracity, scale or privacy, never both sides of the broad listening coin at once. The consequences of these trade-offs are visible wherever broad listening matters.
Politics
In Seeing Like a State, James C. Scott argued that modern states function by imposing what he called legibility on the complex, locally adapted social systems they govern Scott, 1998. Permanent surnames replaced patronymic naming systems that carried rich local information (Scott cites a Welsh court case in which a man identified himself through a string of patronyms perfectly legible to his village but useless to a central government that did not know his father or grandfather). Cadastral maps replaced customary land tenure; standard weights and measures replaced local units that varied by region and trade; nomadic peoples were coerced into permanent settlement. In each case, officials compressed diverse, context-dependent social practices into simplified categories that a central authority could read, record, and act upon. Nuanced people were made legible to literary canons, statistics, samples, and indices.
The compression was necessary because governance requires measurement: a state that cannot identify its citizens cannot tax or conscript them, and a state that cannot map its territory cannot administer it. But Scott documented, across examples ranging from Prussian scientific forestry to Soviet collectivisation to the planned city of Brasília, that the compression systematically destroys what it cannot encode. Local knowledge (what Scott calls mētis, the practical, context-dependent understanding that communities develop through experience) is, by its nature, illegible to centralised institutions. The more a state simplifies its population to govern it, the more it erodes the adaptive complexity that made local systems functional.
Scott’s analysis is usually read as a critique of authoritarian overreach. It is also a diagnosis of what happens when a state’s broad listening tools are inadequate to the complexity of what they govern. The state had statistics (the census, the tax roll), indexing (the cadastral map, the administrative district), sampling (the reports of local officials), and literary canons (the legal code, with its own entrance criteria for what counts as binding precedent). But these could not sufficiently capture the adaptive, context-dependent knowledge that made local systems work, so the state simplified the population to fit the tools it had. The question Scott raises, without fully answering, is whether the compression, and the power it confers on whoever performs it, is a permanent feature of governance or a consequence of the information technology available to govern with.
Economics
In a parallel line of work, Herbert Simon argued that economic agents do not optimise Simon, 1955; 1956. They satisfice: they evaluate options sequentially and select the first one that exceeds an acceptable threshold, because the cost of evaluating all alternatives exceeds their cognitive and temporal capacity Simon, 1982. Simon coined the term “bounded rationality” to describe decision-making under these constraints, and received the Nobel Prize in Economics in 1978 for the resulting body of work.
The implications extend well beyond individual decision-making. The market price system, which Friedrich Hayek had celebrated as a marvel of decentralised coordination Hayek, 1945, is itself a form of compression: each price collapses the multidimensional reality of supply, demand, context, quality, and preference into a single number. Hayek was right that prices coordinate behaviour more effectively than central planning in many domains, but Simon’s work implies that the coordination is bounded by participants’ capacity to process the information prices transmit. When markets move faster than participants can evaluate, when the relevant variables outnumber what any agent can track, participants satisfice. They rely on heuristics, follow signals, delegate to intermediaries (analysts, rating agencies, index funds, algorithmic traders) who compress on their behalf. And the intermediaries who perform the compression acquire influence proportional to the trust placed in their judgment.
The Anne Hathaway effect from Chapter 1 illustrates what happens when this compression fails. The Huffington Post published a story about the actress; algorithmic trading agents, trained on web sentiment, registered a spike in positive mentions of “Hathaway” and bought shares in Berkshire Hathaway, the insurance conglomerate, whose stock price rose measurably on no company-specific news at all. The compression from millions of web pages to a trading signal was too lossy to preserve the distinction between a person and a company. This is a small and almost comic example, but the structure is instructive: market manipulation, insider trading, and the misallocation of capital during speculative bubbles are larger instances of the same dynamic. They are what price discovery produces when the compression is too coarse, too slow, or too easily exploited by actors who can broadcast faster than the market can listen.
But there is a deeper problem with price as a broad listening tool, one that Simon’s framework exposes but does not fully develop. Amartya Sen’s analysis of famine showed that the price mechanism can coordinate efficiently and still produce catastrophic outcomes Sen, 1981. During the Bengal famine of 1943, food production had not collapsed; it was roughly comparable to previous non-famine years. What collapsed was the ability of agricultural labourers to afford food, because wartime inflation had driven prices beyond their reach while their wages stagnated. The market “listened” through prices and concluded, correctly by its own logic, that food should flow toward those who could pay. The result was that food left famine-stricken Bengal for wealthier Calcutta, and roughly three million people starved in a region with adequate food supply. The price system had performed its compression faithfully, but the compression could not encode the difference between “does not demand food” and “cannot afford food.” Sen received the Nobel Prize in 1998 in part for demonstrating that the famine revealed a structural limitation of price as an information technology rather than a market malfunction in the conventional sense: need, dignity, and justice are dimensions of human reality that resist reduction to a number, and a broad listening tool built entirely on statistics will systematically fail to hear them if the schema of that statistic overly compresses that value away… throws away that nuance.
Culture
In 1983, Benedict Anderson argued that the modern nation itself is a product of limited broad listening Anderson, 1983. Before the printing press, most people lived in local communities whose members knew each other directly. The “nation,” a community of millions who would never meet but who believed they shared something fundamental, could not exist, because no broad listening tool could sustain it. What Anderson called “print capitalism” changed this. The newspaper gave millions of strangers the same literary canon to read at roughly the same time, creating what Anderson described as simultaneity: the awareness that others you have never met are reading the same stories, reacting to the same events, and forming the same judgments. National identity was, in Anderson’s analysis, an imagined community made possible by a shared literary canon whose entrance criteria (what the editor chose to print) were controlled by a small number of publishers.
The logic extends beyond nations. Culture centralises whenever a shared canon scales faster than the audience’s ability to evaluate it independently. The publishers and critics who curate a literary tradition determine which books a generation reads; the studios that finance and distribute films determine which stories a civilisation tells itself. Creating and distributing a cultural canon is expensive, the path of least resistance concentrates that investment in a few institutions, and whoever controls the canon acquires disproportionate influence over what a population considers beautiful, important, or true.
The celebrity is sampling applied to culture: one person whose taste, judgment, or lifestyle millions adopt as a proxy for their own, because evaluating all available cultural options independently would exceed any individual’s capacity. The influencer economy that now shapes purchasing decisions, political affiliations, and cultural norms is the industrial-scale version of this mechanism, with algorithmic feeds replacing editorial judgment as the selector of which samples reach which audiences.
The Structural Condition
In 1928, Edward Bernays published Propaganda. Bernays was Sigmund Freud’s nephew, is largely credited as the father of public relations, a major factor in the reason women came to smoke in normative Western culture (he staged a demonstration at the 1929 New York Easter Parade in which debutantes lit Lucky Strikes as “torches of freedom” Bernays, 1928), and the person who engineered the modern American breakfast by commissioning a physician survey on behalf of the Beech-Nut Packing Company and publicising the predictable result Tye, 1998. He understood the structural condition described in the preceding sections well enough to build an industry on it, and opened Propaganda by explaining exactly how:
The conscious and intelligent manipulation of the organized habits and opinions of the masses is an important element in democratic society. Those who manipulate this unseen mechanism of society constitute an invisible government which is the true ruling power of our country.
We are governed, our minds are molded, our tastes formed, our ideas suggested, largely by [people] we have never heard of. This is a logical result of the way in which our democratic society is organized. Vast numbers of human beings must cooperate in this manner if they are to live together as a smoothly functioning society. …
It is not usually realized how necessary these invisible governors are to the orderly functioning of our group life. In theory, every citizen may vote for whom [they please]. Our Constitution does not envisage political parties as part of the mechanism of government, and its framers seem not to have pictured to themselves the existence in our national politics of anything like the modern political machine. But the American voters soon found that without organization and direction their individual votes, cast, perhaps, for dozens or hundreds of candidates, would produce nothing but confusion. Invisible government, in the shape of rudimentary political parties, arose almost overnight. Ever since then we have agreed, for the sake of simplicity and practicality, that party machines should narrow down the field of choice to two candidates, or at most three or four.
In theory, every citizen makes up [their] mind on public questions and matters of private conduct. In practice, if all [people] had to study for themselves the abstruse economic, political, and ethical data involved in every question, they would find it impossible to come to a conclusion about anything. We have voluntarily agreed to let an invisible government sift the data and high-spot the outstanding issues so that our field of choice shall be narrowed to practical proportions. From our leaders and the media they use to reach the public, we accept the evidence and the demarcation of issues bearing upon public questions; from some ethical teacher, be it a minister, a favorite essayist, or merely prevailing opinion, we accept a standardized code of social conduct to which we conform most of the time.
In theory, everybody buys the best and cheapest commodities offered [them] on the market. In practice, if every one went around pricing, and chemically testing before purchasing, the dozens of soaps or fabrics or brands of bread which are for sale, economic life would become hopelessly jammed. To avoid such confusion, society consents to have its choice narrowed to ideas and objects brought to its attention through propaganda of all kinds. There is consequently a vast and continuous effort going on to capture our minds in the interest of some policy or commodity or idea. …
As civilization has become more complex, and as the need for invisible government has been increasingly demonstrated, the technical means have been invented and developed by which opinion may be regimented. With the printing press and the newspaper, the railroad, the telephone, telegraph, radio, and airplanes, ideas can be spread rapidly and even instantaneously over the whole of America. …
[Ideas] can now be given an effectiveness greater than any sectional interest. The common design can be documented and sustained against perversion and betrayal. It can be elaborated and developed steadily and widely without personal, local, and sectional misunderstanding. …
This invisible, intertwining structure of groupings and associations is the mechanism by which democracy has organized its group mind and simplified its mass thinking. To deplore the existence of such a mechanism is to ask for a society such as never was and never will be. To admit that it exists, but expect that it shall not be used, is unreasonable. …
In the days when kings were kings, Louis XIV made his modest remark, “L’État c’est moi.” He was nearly right. But times have changed. The steam engine, the multiple press, and the public school, that trio of the industrial revolution, have taken the power away from kings and given it to the people. The people actually gained power which the king lost. For economic power tends to draw after it political power; and the history of the industrial revolution shows how that power passed from the king and the aristocracy to the bourgeoisie. Universal suffrage and universal schooling reinforced this tendency, and at last even the bourgeoisie stood in fear of the common people. For the masses promised to become king.
To-day, however, a reaction has set in. The minority has discovered a powerful help in influencing majorities. It has found possible so to mold the mind of the masses that they will throw their newly gained strength in the desired direction. In the present structure of society, this practice is inevitable. Whatever of social importance is done today, whether in politics, finance, manufacture, agriculture, charity, education, or other fields, must be done with the help of propaganda. Propaganda is the executive arm of the invisible government.
Universal literacy was supposed to educate the common man to control his environment. Once he could read and write he would have a mind fit to rule. So ran the democratic doctrine. But instead of a mind, universal literacy has given him rubber stamps, rubber stamps inked with advertising slogans, with editorials, with published scientific data, with the trivialities of the tabloids and the platitudes of history, but quite innocent of original thought. Each man’s rubber stamps are the duplicates of millions of others, so that when those millions are exposed to the same stimuli, all receive identical imprints. … The mechanism by which ideas are disseminated on a large scale is propaganda, in the broad sense of an organized effort to spread a particular belief or doctrine. Bernays, 1928
Bernays wrote this in 1928, before television, before the internet, before smartphones, and before algorithmic feeds. What Scott saw in the centralised power of governments, what Simon saw in the centralised power of markets, what Anderson saw in the centralised power of culture, Bernays saw as a unified vision: whoever controls the information that informs decisions controls the decisions themselves. He named this insight, and turned it into the most influential communications industry of the twentieth century. A handful of social media platforms now observe and manage approximately 8.5% of all waking human experience on earth Hootsuite, 2024, driving the bottom line for what are, at the time of writing, five of the six largest companies ever to exist, each of which is either in advertising or the infrastructure that supports it, and which collectively represents approximately $17 trillion in centralised value CompaniesMarketCap, 2026. Bernays’s “rubber stamps” are now algorithmically personalised, his “technical means by which opinion may be regimented” now include recommendation engines and generative AI, and as he specifically described, democratic institutions are broadly ill-prepared to avert this centralisation of power.
Free Listening
And that is because the democratic institutions of the past three centuries, among them free speech, free press, and free assembly, are protections for broadcasting. They guarantee the right to speak, publish, and to organise. They are among humanity’s most important achievements, but they protect one side of the asymmetry: the side that was under threat from centralised broadcasting technology (e.g. the printing press) three centuries ago. The corresponding capacity, the ability to hear independently, to trace a claim back through the evidence and interests that produced it, to know whether the person informing a decision has relevant knowledge or a financial stake in the outcome, has no comparable protection anywhere in the so-called free world.
There is no constitutional right to “free listening.”
Consider what that absence means. A voter can speak freely about any candidate but has limited infrastructure to independently trace what that candidate has done, said, promised, and broken. A patient can freely choose a physician but has little means to see whether the treatment they receive reflects the best available evidence or the most recent pharmaceutical sales visit. A common citizen can read freely that a policy will create jobs or destroy them but has almost no ability to follow the claim back through the data, the statistical model, and the interests behind it. In each case, the individual need not be unintelligent; they lack equipment. They may have always had the right to speak about any of these matters, but modern citizens broadly have never had the means to hear at this level of scale. Free speech, without free listening, protects the right to shout into a storm. Free speech is worthless if no one can hear you.
This is not a recent oversight. It is the terms of a bargain as old as speech itself. Before language, people could not pass experience to anyone else. A person could learn through experience, through pain, that certain food was dangerous, that certain terrain was impassable, that certain weather was lethal, but they could not tell anyone, because they had no words. And so the people around them could not be warned, and subsequently suffered the same pain, made the same discoveries, and died of the same mistakes generation after generation, with little improving except through the glacial accidents of natural selection.
And then someone spoke.
For the first time, one person’s experience could become another person’s knowledge. A community that could share information could better coordinate, could warn, could teach, could accumulate understanding across lifetimes instead of losing it every time someone died. This made human beings powerful over nature in a way no other species had ever been. But for the purpose of coordination, it also made them increasingly powerful over each other.
The challenge is that if one gives power to a leader (of a family, tribe, county, or nation), but all of the leader’s subjects observe all the information the leader observes, all of the decisions the leader makes, and all of the outcomes of those decisions, and they can observe each other’s shared reactions and understandings of that leader, they have not actually given power to the leader. Instead, they are ruling through direct democracy and the leader is merely a figurehead. The instrument of a leader’s power is made possible through information asymmetries, through the leader taking in more information about the state of the world and their behaviour in it than the subjects do. Without that information asymmetry, the leader is not leading. And as Bernays points out, that information asymmetry has also been a practical necessity for everyone involved.
It is the information bottleneck of leadership, the compression of leadership, and whoever performed it acquired power over everyone who depended on it: power to shape what the community believed, what it feared, what it valued, and what it did. The bargain was implicit and, for most of human history, unavoidable19: surrender some of your autonomy to someone who processes more or different information than you can, and in return, benefit from coordination you and your community could never achieve in a decentralised manner. The alternative was for everyone in a community to redundantly process everything themselves, which means grinding the coordination capacity of a local community to a halt.
Unfortunately, every information technology since language has extended the reach of the speaker without extending the capacity of the listener, and every such extension has raised the price of the bargain. Writing allowed experience to be recorded across centuries, but it also allowed priests and scribes to control what was recorded more so than the readers controlling what was written. Printing allowed ideas to reach millions, but it also allowed publishers and censors to decide which ideas more so than the masses to decide what they needed to know. Broadcasting allowed a single voice to reach an entire nation, but it also allowed that single voice to drown out every other more so than the listeners drawing out the information they collectively most need. At each stage of increasing broadcasting scale relative to listening scale, the intermediaries grew larger, more distant, and less accountable, following Granovetter’s logic of strong-ties from Chapter 4. Tribe leaders became pharaohs, pharaohs gave way to parliaments, parliaments gave way to corporations, and now the corporations that mediate the largest share of human attention in history are building the technology that could mediate human judgment itself. The distance between the governed and the governors has never been greater, the compression has never been less visible (i.e. recommender engines, LLM chatbots), and the people living inside it have never had less ability to inspect what is being decided on their behalf, or by whom, or why.
The entire preceding analysis describes variations of this single structural fact. Scott’s legible state compressed local knowledge into centralised categories and governed through the compression. Simon’s bounded organisation compressed market signals into administrative hierarchies and allocated through the compression. Sen’s price mechanism compressed human need into exchange value and let three million people starve because the compression could not encode the difference between hunger and effective demand. Anderson’s imagined community compressed cultural identity into narratives selected by publishers and broadcasters, and the people inside those narratives had no way to inspect the selection. Bernays saw all of this, named it, and built an industry on it. In each case, the bargain was the same: accept the compression, benefit from the coordination, and pay with your autonomy; in every case, listening did not scale without an intermediary; and in every case, the intermediary became even less accountable to the even larger group of people whose hearing it replaced.
What Changes
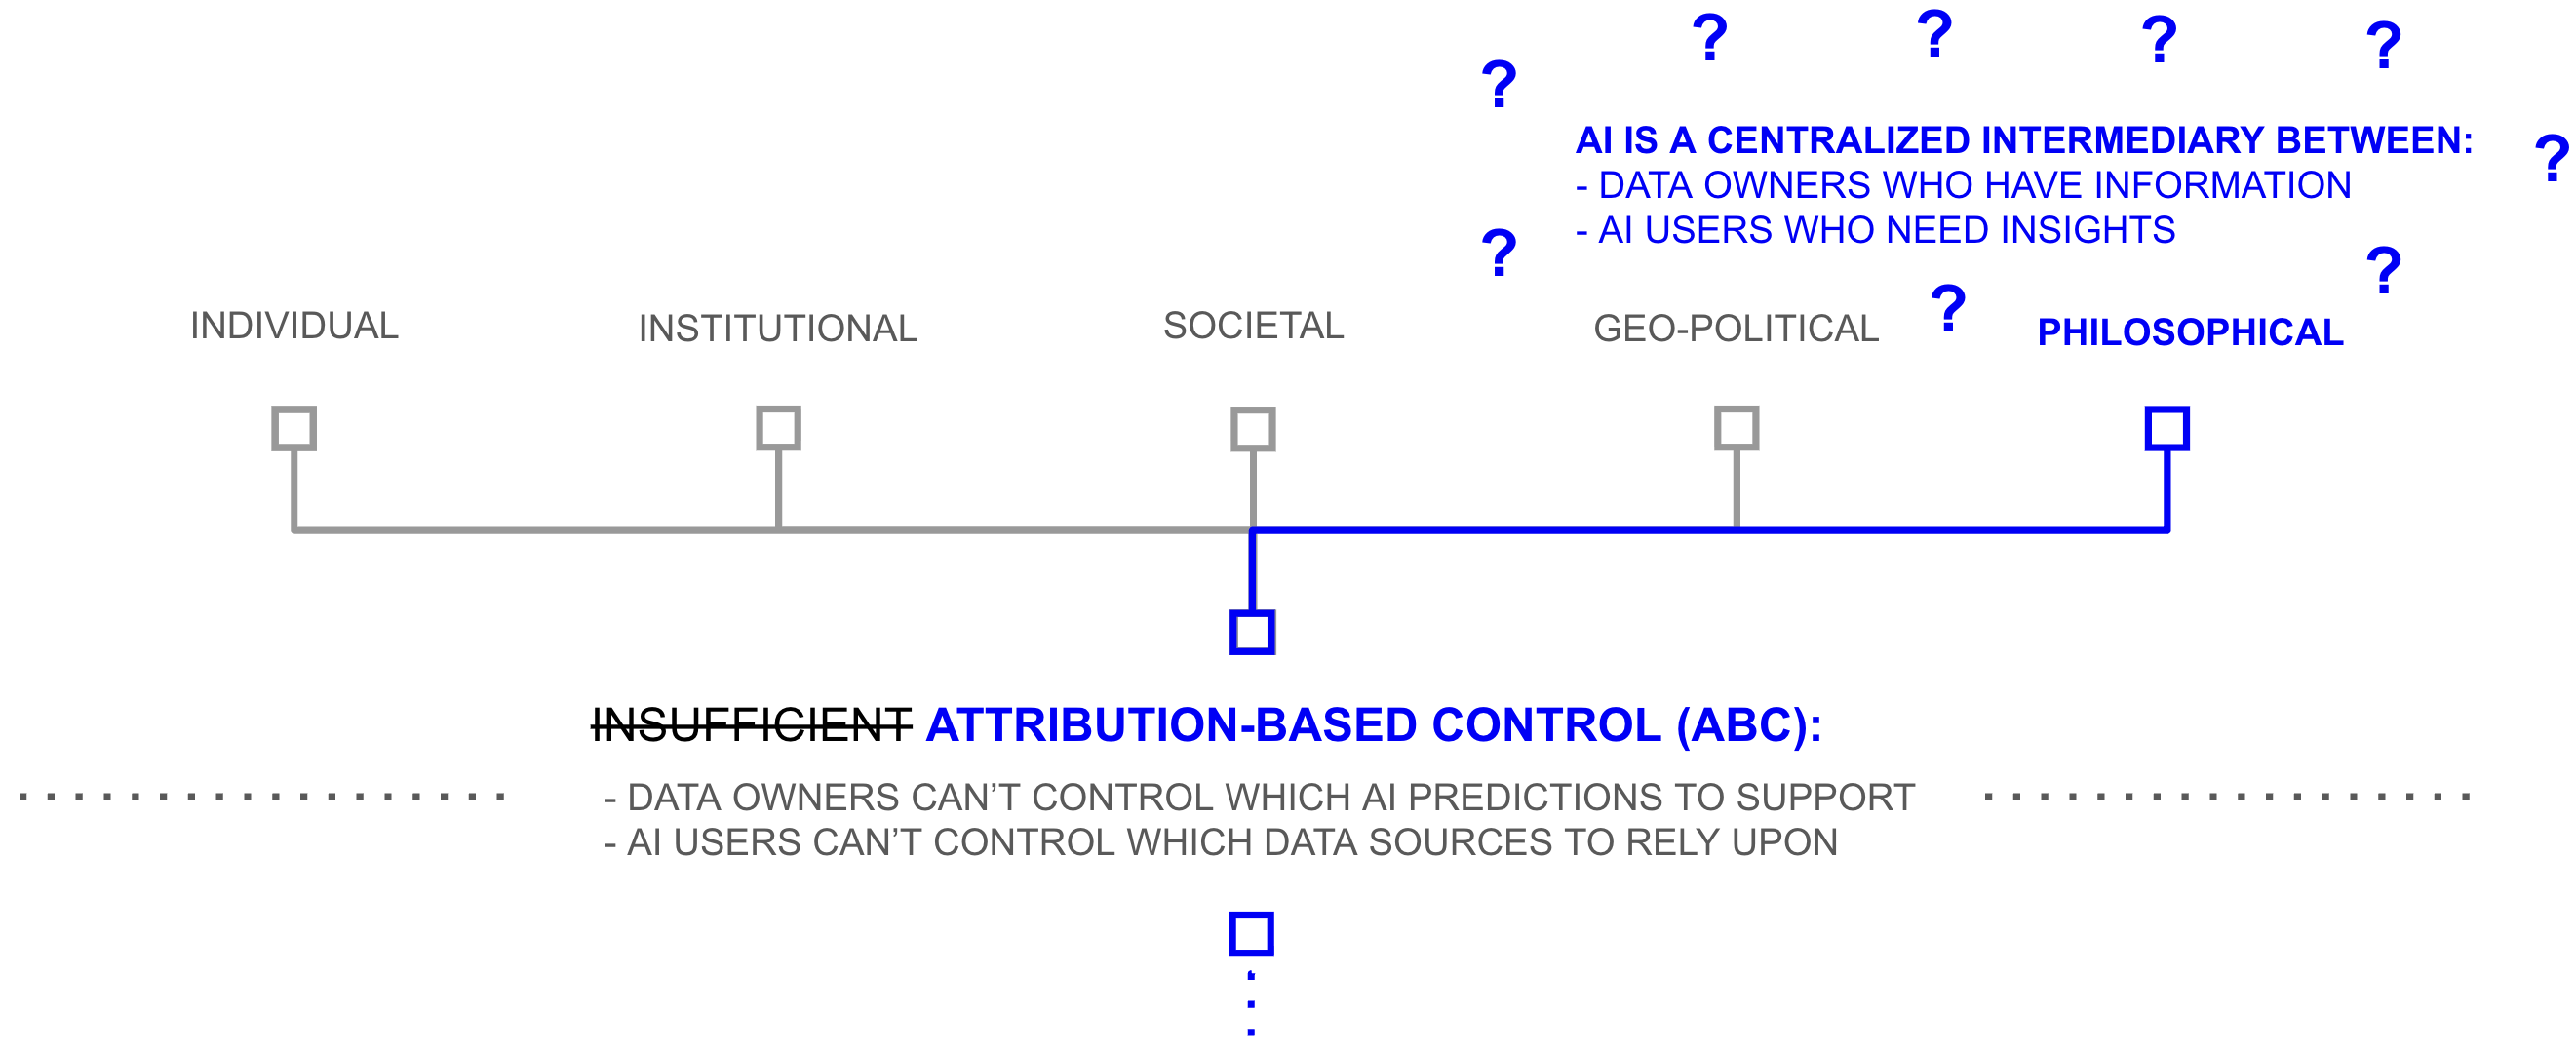
AI is the first technology with the broad listening potential to entirely renegotiate this bargain between leaders and followers, not necessarily by eliminating intermediaries entirely (as Chapter 4 described, which would run into problems of trust at scale) but by building listening infrastructure that does not require large intermediaries: the first broad listening tool that enables one to hear across the full breadth of human experience with the nuance of a literary canon and the scale of a statistic. Not AI as currently built, which centralises the listening function into opaque models controlled by the institutions that trained them, but AI as this thesis has described it: a system in which every answer can be traced back to the sources that informed it, in which the trust placed in those sources flows through paths the person asking can inspect, in which the data that makes the system intelligent remains under the control of the people who provided it, and in which anyone who does not like how their contribution is being used can leave, and the system loses that contribution until consent is restored, an AI system with attribution-based control.
The mechanism that makes this possible need not be large if it is recursive. BaconRank propagates trust through connections between people who actually know each other: the fifty or so relationships close enough that one person can genuinely judge another’s competence on a given subject, and it has been estimated that four to six such hops connect any two people on earth. The architecture of broad listening, the infrastructure that could replace Bernays’s invisible intermediaries with a system whose trust paths any participant can see and whose terms any participant can set, runs on the oldest and smallest unit of human social organisation: not a platform, an institution, or a government, but individual people who know each other well enough to say whether the other can be trusted, and who are willing to stake their own reputation on that assessment. Deep voting preserves the link between what those people know and what the system concludes, and structured transparency ensures that participating does not require surrendering control. Together, they describe a system that is intelligent because the people who compose it are, and that remains accountable because any of them can revaluate that trust, and can walk away from a source of intelligence if they desire.
This is recognisably what Licklider described as “cooperative modeling”: a network through which the collected experience of its participants becomes available to each of them, weighted by trust they chose. And if this path is viable, modern society has the potential to renegotiate the bargain between the governors and the governed. For a quarter of a million years, the price of coordination across larger and larger groups facilitated by higher and higher scale broadcasting technology has been autonomy: the governed surrender hearing to the governors, the governors compress information on their behalf, and the governed have little-to-no infrastructure to see what was lost in the compression. If listening can scale without large intermediaries, if individuals can hear across the full breadth of human experience through networks of people they trust, then the structural reason that legislatures, corporations, publishers, and platforms hold power in their current form is no longer a technical necessity, but a choice. The institutions may persist, and in many contexts they should, but the basis on which they hold authority, the assumption that large numbers of people cannot hear or collectively make decisions for themselves and therefore must be heard for, is removable for the first time since the assumption became true.
The stakes of that removal are higher than for any previous information technology. The library, encyclopedia, and mainframe each affected what people could speak at scale: which texts were accessible, which facts were included, which computations could be performed. AI affects how people hear and decide: which options appear, which evidence carries weight, which conclusions feel warranted. A centralised library limits access to information, but a centralised AI shapes the process of informed judgment itself, and following Bernays’s thesis, the companies building AI at the greatest scale include advertising companies whose revenue depends on the very broadcasting-listening asymmetry that broad listening would close.
The Window
Licklider is the only figure in the historical pattern who shortened the centralised phase deliberately rather than waiting for it to run its course. He recognised, while the mainframe era was still at its height, that the technical ingredients for federation existed, and he used public investment to build that infrastructure before central intermediaries could lock in their advantage. The ARPANET still produced powerful companies, but it ensured they emerged on top of public protocols rather than in place of them.
The conditions that enabled his intervention are present today. The centralised phase of AI is early enough that the technical path remains open, the ingredients for a federated alternative exist, as this thesis has attempted to document, and the problems created by centralisation are generating political, legal, and market pressure for alternatives. But the window in which the path remains open is narrowing. The centralised institutions are accumulating advantages, among them proprietary data, trained models, user dependence, and regulatory relationships, that compound with each passing quarter. And unlike the mainframe era, where the centralising institutions were hardware manufacturers with less structural interest in opposing federation, some of the centralising institutions in AI are advertising companies whose revenue depends on the very asymmetry that broad listening would close. Every quarter that passes without federated infrastructure is a quarter in which the chance to build it diminishes because the economic and political barriers are given time to grow.
Yet, Licklider did not publish a paper arguing that the mainframe era should end and then wait to see what happened. He built the infrastructure that would make federation possible before the centralised institutions could lock in their advantage, and he did it while holding a position that gave him authority over where public money went. The argument in “The Computer as a Communication Device” was important, but the ARPANET was what mattered. The argument described a window; the construction determined whether anyone walked through it.
The preceding analysis does something Licklider’s argument did. It traces the structural pattern, identifies the moment in the cycle, names the causes of centralisation, and describes technical paths that address each one. What it cannot do—what no argument can do—is shorten the peak. That requires building infrastructure, and building infrastructure at the scale and speed that the window’s narrowing demands requires that the people who understand what is at stake treat that understanding as a reason to act rather than a reason to observe.
The window Licklider walked through was available for roughly a decade before the mainframe institutions had accumulated enough network effects, regulatory relationships, and researcher dependence to close it. Whether the window in AI is comparably narrow, wider, or already closing faster than that estimate suggests is genuinely uncertain, and this thesis cannot resolve it. What is clear from the historical pattern is that the window does not stay open indefinitely, and that the institutions whose revenue depends on the broadcasting-listening asymmetry broad listening would close are not passive. They are building network effects, accumulating training data, funding the researchers whose work determines what comes next, and shaping the regulatory conversation in every jurisdiction that is trying to understand what AI governance should look like. These are not the actions of institutions that expect the centralised phase to give way easily. The technical path this thesis describes is viable. Whether it becomes actual depends on whether the people who see it also build it.
Freedom
Three centuries of democratic struggle produced the most important set of rights any civilisation has secured: the right to speak, publish, associate, and hold power accountable through open deliberation. These rights were won by people who understood that the freedom to send information outward was worth defending even when the defence was costly, and they were right. They remain among the most important things any society has done.
But they protect one side of the asymmetry: the side that was under threat when the printing press gave centralised institutions the power to determine which ideas reached which people. The corresponding capacity—the ability to hear independently, to trace a claim back through the evidence and interests that produced it, to know whether the person informing a decision has relevant knowledge or a financial stake in the outcome—has no comparable protection anywhere in the free world. There is no constitutional right to free listening, and the reason is not political failure. It is that until now, the equipment did not exist. Listening has never scaled without surrendering the listening to someone else, and you cannot secure a right to infrastructure that does not yet exist.
The people who secured free speech understood, as Bernays understood from the other side, that controlling what reaches people is controlling what they can decide. They fought the right fight with the tools available in the seventeenth and eighteenth centuries: strip the power to censor from the institutions that held it, and ideas will compete on their merits. What they could not anticipate was that the technology of the following centuries would scale broadcasting so far beyond listening that the censorship problem would eventually become secondary to the synthesis problem. The state no longer needs to prevent you from speaking. It, or the corporation that has replaced it in this function, needs only to ensure that what you say cannot be heard above the noise, that the sources informing the decisions of the people around you remain invisible, and that the infrastructure for evaluating and weighting competing claims remains controlled by institutions with structural interests in the outcome. Free speech without free listening is the right to shout into a storm. The words go out. Nothing legible comes back.
The architecture this thesis describes is a specification of what the equipment for free listening would need to do: preserve the link between a prediction and the sources that informed it; allow data owners to participate without surrendering copies of their information; propagate trust through networks of people who actually know each other, so that the scale of synthesis does not require delegating judgment to an institution whose decisions the people it serves cannot inspect. These are engineering requirements, and the preceding chapters have argued that they are tractable. The gap between a tractable engineering problem and built infrastructure is work, and the work is political and economic as much as it is technical: open protocols require funding, adoption, and the sustained effort of people who understand why the foundational layer must remain open before the application layer forecloses the possibility.
Licklider did not just understand what was needed. He was in a position to fund it, and he used that position before the window closed. The question this thesis cannot answer on anyone’s behalf is what position the people who understand the argument are in, and what they will do with it.
The End
Before language, what a person learned died with them. Someone ate the wrong plant, stayed too long at the river, walked into weather that would kill them, and the people around them watched, and the next season someone else made the same discovery at the same cost. Whatever could not be inherited biologically was lost. Each generation began again.
And then someone spoke, and the terms of being human changed. Experience could become knowledge, knowledge could travel, knowledge could accumulate across lifetimes and generations, and a community that could warn and teach and coordinate could do what no isolated individual could do: survive nature at a scale that let nature be survived. The price of that coordination was the bargain this epilogue has traced through every information technology since: surrender some hearing to someone who can compress more than you can, and receive in return the coordination that compression makes possible. The bargain was worth it. Against the river, the poison, the predator, the disease, the terms were favourable. The civilisation that produced this thesis, its institutions, its accumulated understanding of what large groups of people need, exists because the bargain kept being made.
But the terms have changed. The rivers are dammed, the plants are catalogued, the predators are gone, and the diseases that killed children before they could speak are, in most of the world, curable. The case for surrendering hearing to governors whose decisions the governed cannot see was always strongest when the alternative to coordination was nature, and nature was worse. The people who built the great centralised listening institutions of the last few centuries—the newspapers, the broadcasters, the platforms, and now the AI laboratories—did not build them out of malice. They built them because centralisation was the only available path to coordination at scale, and coordination at scale was necessary, and the people who chose not to build them ceded the coordination to those who did. The bargain was not a mistake. It was the rational response to the tools available.
What has changed is that a different response is now technically possible, and therefore a different choice is now available, possibly for the first time in the 250,000-year history of the bargain. Whether the infrastructure for that choice gets built—whether the window stays open long enough, and whether the people who understand what is at stake act in time—determines something more fundamental than AI policy. A centralised library limited what a scholar could read. A centralised encyclopedia limited which facts were included in the reference a generation consulted. A centralised mainframe limited which institutions could afford to compute. Each constrained access to information but left the process of individual judgment largely intact. An AI system that a significant and growing fraction of the world uses to decide what to believe, what options exist, and what to do operates at a different layer. It does not limit access to information. It shapes the process of informed judgment itself—which evidence feels relevant, which conclusions feel warranted, which possibilities appear. And it does this at a scale and with an invisibility that Bernays, who built an industry on the visibility of the same mechanism, could not have imagined.
Free speech was secured by people who understood that the freedom to send information outward was worth the cost of the fight. They were right, and the right they secured is among the most important things any civilisation has done. The corresponding right—to hear from sources whose provenance is visible, whose interests are legible, whose conclusions can be traced back through the evidence that produced them—has waited for infrastructure that did not yet exist. The infrastructure is now describable. Whether it becomes buildable, and whether the people who can build it do so before the window closes, is the question that the technical work in this thesis cannot answer.
For a quarter of a million years, the governed and the governors have not been the same people, because listening did not scale without surrendering it, and whoever performed the compression held power proportional to its scope. That condition is now, for the first time, technically removable.
The people who will determine what happens next are not abstract. They are researchers who understand the architecture and choose where to work. They are funders who see the window and choose what to back. They are policymakers who grasp the historical pattern and choose which infrastructure receives public investment, and which is left to be built closed by institutions whose revenue depends on keeping it that way. Each of them will make that choice—is already making it—and the choice compounds. Licklider did not wait to see what the mainframe era would produce. He decided, while it was still producing, that the next layer would be open, and he used the position he held to make that decision real. The position each of these people holds is different from his. The decision is the same.
References
- (2001). Libraries in the Ancient World. Yale University Press.
- (c. 170 CE). Commentary on Hippocrates’ Epidemics.
- (1989). The Vanished Library: A Wonder of the Ancient World. University of California Press.
- (2003). Progymnasmata: Greek Textbooks of Prose Composition and Rhetoric. Society of Biblical Literature.
- The Diamond Sutra.
- (1998). Seeing Like a State: How Certain Schemes to Improve the Human Condition Have Failed. Yale University Press.
- (1751–1772). Encyclopédie, ou dictionnaire raisonné des sciences, des arts et des métiers.
- Denis Diderot.
- (1937). World Brain. Methuen & Co.
- Wikipedia: Governance.
- (2017). Torching the Modern-Day Library of Alexandria. The Atlantic.
- (1960). Man-Computer Symbiosis. IRE Transactions on Human Factors in Electronics, HFE-1(1), 4–11.
- (2018). Change and Continuity at IBM: Key Themes in Histories of IBM. Business History Review, 92(1), 117–148.
- (1968). The Computer as a Communication Device. Science and Technology, 76, 21–31.
- (1955). A Behavioral Model of Rational Choice. The Quarterly Journal of Economics, 69(1), 99–118.
- (1956). Rational Choice and the Structure of the Environment. Psychological Review, 63(2), 129–138.
- (1982). Models of Bounded Rationality. MIT Press.
- (1945). The Use of Knowledge in Society. The American Economic Review, 35(4), 519–530.
- (1981). Poverty and Famines: An Essay on Entitlement and Deprivation. Oxford University Press.
- (1983). Imagined Communities: Reflections on the Origin and Spread of Nationalism. Verso.
- (1928). Propaganda. Horace Liveright.
- (1998). The Father of Spin: Edward L. Bernays and the Birth of Public Relations. Crown Publishers.
- (2024). Digital 2024 Global Overview Report.
- (2026). Largest Companies by Market Capitalization.
- (1990). Governing the Commons: The Evolution of Institutions for Collective Action. Cambridge University Press.